
How to Find a Creator’s Outlier Posts (and Why Top-Posts Lists Lie)
Sorting a profile by likes tells you which posts are oldest and which accounts are biggest. It rarely tells you what worked. Outliers do.
 Claude
 Perplexity
Open any creator’s profile, sort by likes, and you get a list that looks useful. It mostly isn’t. The top of that list is dominated by two things that have nothing to do with whether a post was good: how long it has been live, and how big the account was when it went out.
If you copy the top of a raw leaderboard, you are copying the past and the famous. If you want to know what actually worked, you need to compare each post against the creator’s own normal. That is what an outlier is.
What an outlier actually is
An outlier is a post that performed far above that same creator’s typical post. Not above the platform average, and not above a bigger competitor. Above themselves.
That framing matters because it cancels out the two distortions. A creator with 2 million followers and a creator with 20,000 each have a typical post. When a post does 10x the typical result for its own author, something about the idea, the hook or the format landed, and that is the thing worth studying.
Why raw top-posts lists lie
- Age. A post from two years ago has had two years to collect likes. Last week’s post has had a week. Ranking them together rewards time, not quality.
- Audience size. A creator’s follower count changes. A post from when they had 300K followers isn’t comparable to one from when they had 1.5M.
- Format mix. Some formats are simply shown to more people on a given platform. If a profile is 95% Reels, the top of the list will be Reels whether or not Reels are what made them grow.
- Survivorship. Creators delete and archive the posts that flopped. What’s left on the grid is already filtered.
How to find outliers, step by step
- Pick three to five profiles you already learn from in your niche. Mix sizes on purpose: one big account, a couple of mid-sized ones, one small account that is growing.
- Capture enough history. You need dozens of posts per profile for a median to mean anything, so scroll back a few months, not a few days.
- Work out each profile’s typical post: the median engagement across what you captured. Use the median, not the average, so one viral post doesn’t drag the baseline up.
- Score every post as a multiple of that median. A post at 5x its creator’s median is a real signal. A post at 1.2x is noise.
- Read the outliers side by side. Look for what they share: the opener, the format, the length, the topic, the day they went out.
You can do this by hand in a spreadsheet. It takes an afternoon per profile, and it’s the reason most people never do it.
Doing it in Marketpon
Marketpon does the counting for you. You browse a profile with the Chrome extension running, and every post you scroll past is recorded with the engagement your browser can see. In the research library, every post is marked against that creator’s own typical post, so a card reads “54.1x their typical post” instead of just showing a like count.
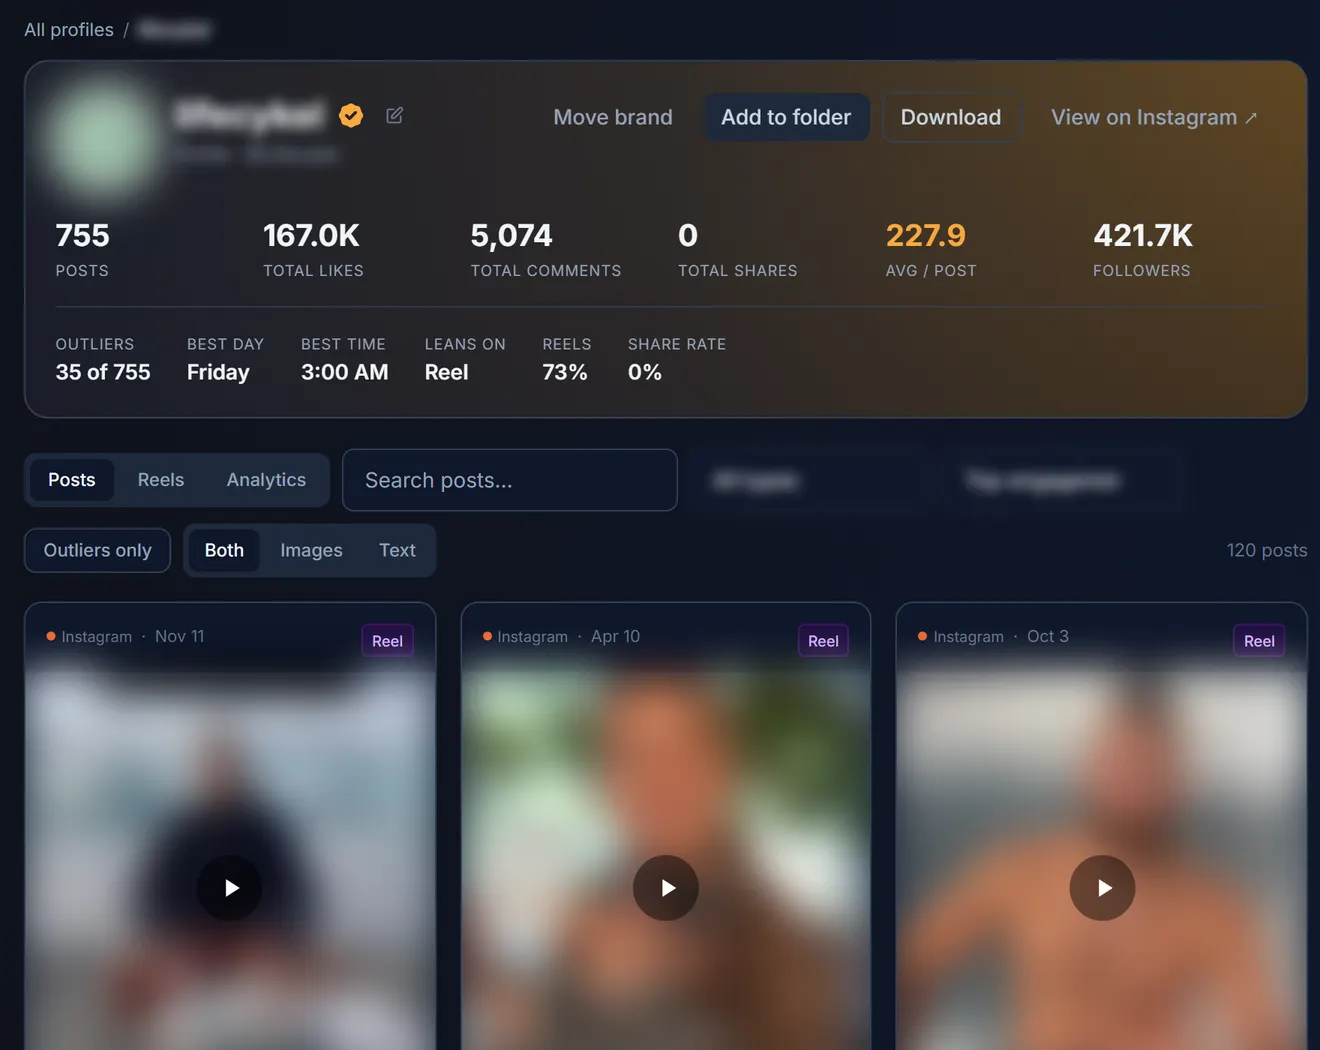
The profile header also shows how many posts out of everything captured are outliers (for example, 35 of 755), the best day and time that profile’s posts land, and the format it leans on. Discovery then ranks the top 1% of every post you have captured across every profile, so a small account’s breakout can outrank a big account’s average post.
What to do with the outliers you find
- Extract the mechanic, not the words. Write down why you think it worked: the promise in the first line, the structure, the format. Then make your own version for your audience.
- Check it is repeatable. One outlier is an anecdote. Three outliers sharing an opener style is a pattern.
- Hand the evidence to your AI. Export the outliers and ask your AI what they have in common. You get much better answers from counted examples than from a blank prompt.
Capturing a post doesn’t give you permission to reuse its wording, images or video. Study the pattern, then make something original.
Frequently asked questions
What counts as an outlier post?
A post that performed far above its own author’s typical (median) post. Marketpon shows each post as a multiple of that median, for example “9.36x their typical post”.
Why use the median instead of the average?
One viral post can drag an average up so far that nothing else looks good. The median is the post in the middle, so it describes what “normal” looks like for that creator.
How many posts do I need per profile?
Dozens at least. A median built from a handful of posts moves around too much to trust. Scroll back a few months of history when you capture.
Which platforms does Marketpon support?
Facebook, Instagram, TikTok, LinkedIn and X. What is captured depends on the posts and metrics each platform shows in your browser.