
Compare Social Media Profiles Side by Side Without a Spreadsheet
The account with the most followers is rarely the one you should learn from. Here is how to compare profiles on numbers that put them on equal footing.
 Claude
 Perplexity
Competitor research usually starts with follower counts and ends there. That’s a mistake. A 1.5M-follower account and a 70K-follower account are playing different games, and the bigger one is often coasting.
The metrics that actually compare
- Engagement per 1K followers. Divides out audience size, so a small account that punches above its weight shows up immediately.
- Outliers. How many posts beat their own author’s median by a wide margin. More outliers means more ideas that landed.
- Format share. What share of posts are Reels, carousels, images or text. Tells you what each account bets on.
- Share rate. Shares per post relative to reach. Shares are the strongest signal that content travels beyond the existing audience.
- Best day and time. When each account’s posts actually land, not when the platform says to post.
How to read a comparison
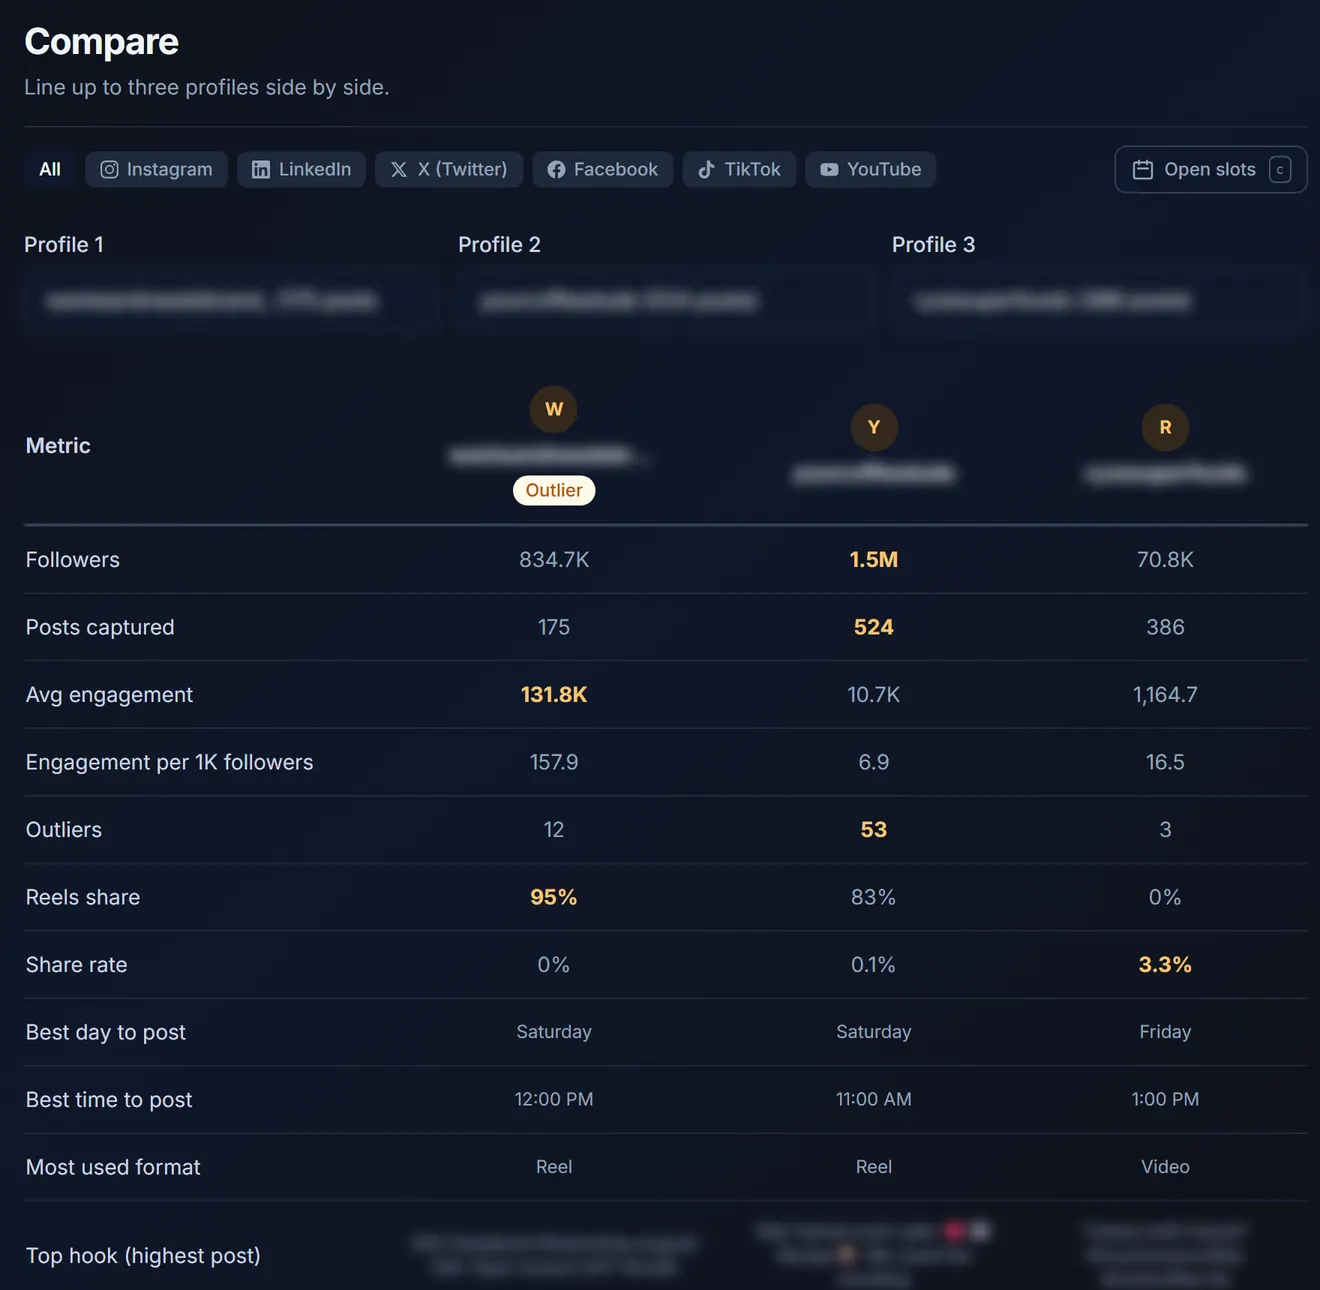
In the screen above, the account with 1.5M followers averages 6.9 engagements per 1K followers. The one with 834K averages 157.9, more than twenty times as much relative to its size. The smallest, at 70.8K, has the best share rate of the three at 3.3%. Three accounts, three different lessons.
- Start with engagement per 1K followers to find who is efficient, not just big.
- Check outliers to see who has the most ideas that broke out.
- Look at format share next to performance. If an account is 95% Reels and efficient, the format is part of the story.
- Use best day and time as a hypothesis to test, not a rule.
- Open the top hook for each profile and compare how they start their best posts.
Doing it in Marketpon
Capture each profile with the extension, then open Compare and pick up to three. Marketpon lines them up on all of the metrics above, highlights the leader in each row, and shows each profile’s top hook. No exporting to a spreadsheet, no formulas.
Frequently asked questions
What is a good engagement rate?
It depends heavily on platform, niche and account size, which is why comparing accounts in your own niche on engagement per 1K followers is more useful than a universal benchmark.
How many profiles can I compare at once?
Up to three side by side in Marketpon’s Compare view.
Can I compare profiles across different platforms?
You can capture profiles on Facebook, Instagram, TikTok, LinkedIn and X. Comparisons are most meaningful within one platform, since each shows different metrics.